The company discloses in what way it has implemented national and international processes and what goals it has for the promotion of equal opportunities and diversity, occupational health and safety, participation rights, the integration of migrants and people with disabilities, fair pay as well as a work-life balance and how it will achieve these.
Diversity: both personal and cultural
As a company with an international outlook, Munich Airport benefits from the diversity of its employees. It respects the cultural heritage of all of its employees, taking into account their diverse interests and needs. Some 24 percent of Group employees come from more than 100 different countries. Most non-German employees come from Turkey, followed by Croatia and Hungary. Because acceptance and mutual respect play an important role in this, all managers and employees are aware of and observe the German General Equal Treatment Act (AGG).
As an employer, FMG’s Human Resources corporate division accepts responsibility for its employees, ensures equal opportunities, and offers prospects at all levels.
When filling open positions, FMG primarily follows the principle of suitability (pursuant to § 1 AGG). Equality is an expression of the core of its brand «Living ideas – Connecting lives» and helps to implement the brand values of the company. In its efforts to gradually increase the share of women, the Munich Airport Group formulated individual targets per management level instead of a fixed quota. FMG possesses a great deal of expertise in the deployment and development of employees with impaired health.
In order to achieve its goals, FMG is publicly positioning itself on this topic, actively supporting an increase in the proportion of women in management positions, for example by optimizing re-entry opportunities, making managers’ employment conditions more flexible, and promoting qualified female employees by creating development measures. Munich Airport Group has set itself the target of successively increasing the proportion of women in these roles. In autumn 2017, individual target figures were agreed to this end, and as a follow-up deadline, a three-year period up to June 30, 2020 was defined. Women receive support at the start of their management activity, for example, via the «cross-mentoring program», in which each participant is assigned a manager from another company as a mentor for a period of one year. The aim of the «MStars» network for female FMG managers is to promote continuous exchange between professionally successful women within and outside the company. In 2018, it was possible to expand the network further, and intensify the cooperation with other companies. Initial events also took place that were specifically aimed at a female audience, which Munich Airport initiated or supported.
FMG has a representative in the Health and Social Management department of the Human Resources division, who is responsible for representing employees in matters that affect severely disabled people, and who serves as a contact person for severely disabled employees (see: SGB IX, Rehabilitation and Participation of Disabled People). In addition, FMG also participates in inclusion projects, such as its cooperation with the Freisinger Fröbelschule BiG [Education Center on Gartenstrasse], an institution of the Freisinger Lebenshilfe e.V.
FMG provides a range of offerings to ensure equal opportunities within the company: occupational integration management, the continued employment of employees whose abilities have changed, the recruitment of people with severe disabilities, and the training of young adults whose intellectual development must be supported.
Where appropriate, individual performance-based compensation targets are defined with level 2 managers.
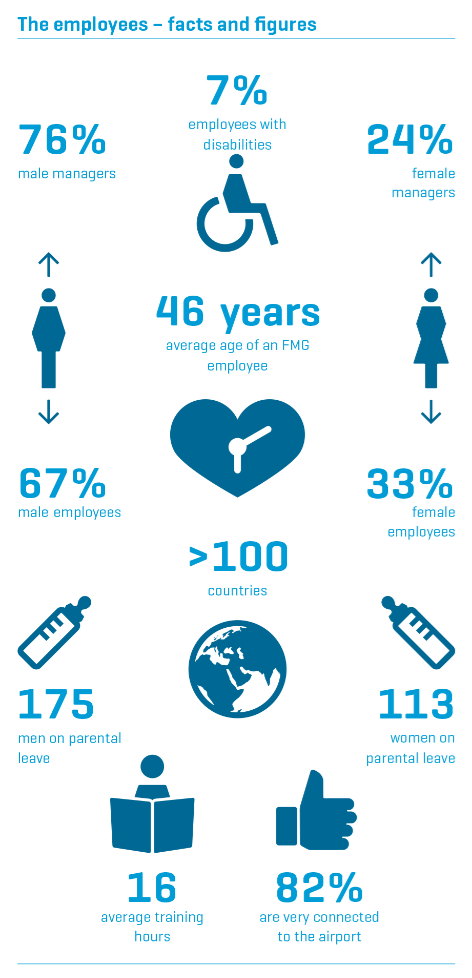
Wage differences by gender
Since there are pay scale agreements within almost all companies across the Munich Airport Group, there are no pay differences between men and women involved in comparable activities.
Business locations and suppliers where a potential threat to the right to freedom of association or collective bargaining could exist
There were no instances of restriction of the right to freedom of association or collective bargaining in the reporting period.
Personnel expenses and payments above the general pay scale
Flughafen München GmbH is a member of the regional public employers’ association of Bavaria and, as such, is bound by the TVöD collective pay scale agreement for public sector employees. FMG employees participate in a company retirement scheme, which is governed by the pay scale agreement and covered by the Bavarian supplementary pension fund for municipal employers. Following negotiations with the labor unions ver.di and dbb, the remuneration for employees of FMG and AeroGround was increased as at March 1, 2018; in the first step this increase was on average 3.19 percent. Lower-paid wage groups tended to profit more from this collective agreement. In addition, two further wage increases were agreed: For April 2019, an average increase of 3.09 percent was agreed and from March 2020, employees will receive on average 1.06 percent more in their pay packets.